Langston University, Oklahoma’s only historically Black college and university (HBCU), graduates roughly one in four students within six years of enrollment. Official data from the Oklahoma State Regents for Higher Education show graduation rates fluctuating between 18% and 32% over the past decade. Most cohorts hover around 24% to 26% completing within six years, while only 10% to 17% of students finish in the standard four-year timeframe.
In total, Langston University awards around 340 to 360 degrees per year, most of them undergraduate degrees, with women representing about 70% of graduates. Graduate and professional programs (such as Physical Therapy and Rehabilitation Counseling) have significantly higher completion rates, some exceeding 90%.
Langston University at a Glance
| Metric | Most Recent Data (2023–2024) | Source |
| Total enrollment | ~2,400 students (undergraduate & graduate) | Langston Fact Book 2023–24 |
| Undergraduate degrees awarded | ~310 | College Factual |
| Graduate & professional degrees awarded | ~44 | College Factual |
| 4-year graduation rate | 10–17% | Data USA / College Tuition Compare |
| 6-year graduation rate | 23–29% | OKHigherEd / College Factual |
| 8-year graduation rate | ~30% | Data USA |
| Freshman retention rate | 55–65% | College Factual / College Tuition Compare |
| Top majors | Nursing, Education, Business, Rehabilitation Counseling | Langston Fact Book |
| Students staying in Oklahoma after graduation | 98.8% (residents) | Langston “At a Glance” Report |
A Decade of Graduation Trends
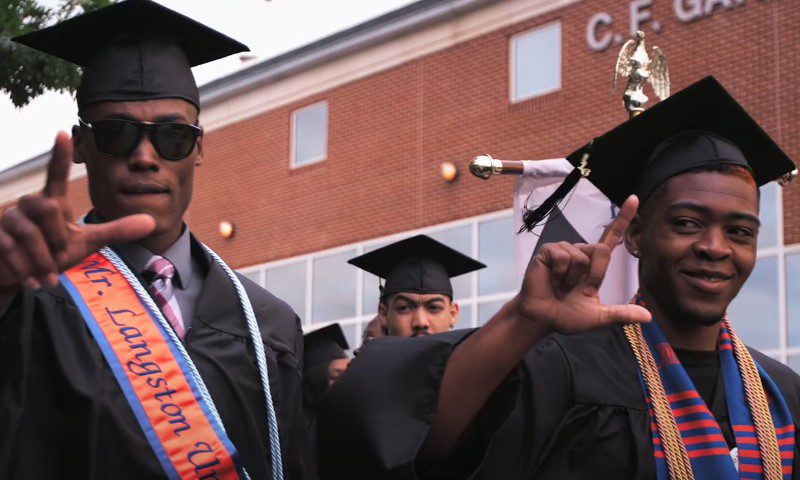
@isdatkingo Langston University 2025 ?? #hbcugraduate #hbcupride #hbcugrad
Between 2012 and 2021, Langston’s six-year graduation rate moved between 18% and 32%, showing slow improvement but continuing volatility due to small class sizes and socioeconomic shifts in student demographics.
| Academic Year | Graduation Rate (6-Year, Same Institution) | Notes |
| 2012 | 26.2% | Oklahoma Higher Education Board |
| 2013 | 29.0% | |
| 2014 | 26.1% | |
| 2015 | 21.4% | Post-recession enrollment dip |
| 2016 | 19.1% | |
| 2017 | 18.1% | Lowest rate in decaa de |
| 2018 | 24.0% | Recovery period |
| 2019 | 32.4% | Strongest performance year |
| 2020 | 31.5% | Consistent improvement |
| 2021 | 28.4% | Stable post-pandemic levels |
By comparison, the national average six-year graduation rate for public universities in the U.S. is about 62% (National Center for Education Statistics, 2024). Langston’s numbers, while lower, reflect trends similar to other smaller HBCUs that serve high proportions of first-generation and low-income students.
Numbers Behind Graduation Rates
Graduation rate data represent only one part of a student’s educational path. For Langston, several factors influence these outcomes:
1. Student Demographics and Preparedness
A majority of Langston University’s undergraduates are first-generation college students and often come from economically challenged backgrounds. The university’s mission, as an HBCU, focuses on accessibility and opportunity rather than selectivity. As a result, retention and completion require additional support structures such as tutoring, mentoring, and financial aid stability.
2. Retention and Transfer Behavior
Freshman retention rates at Langston average 57–60%, meaning about four in ten freshmen do not return for their sophomore year. Of those who leave, about 32% transfer to other institutions, while roughly 68% drop out or lose contact. These patterns mirror national trends among smaller regional universities.
3. Program-Specific Performance
Langston’s Physical Therapy program has a remarkable 92% graduation rate, showing the strength of its professional schools. The Nursing program also maintains consistent licensure pass rates above 80%, suggesting strong academic rigor once students progress into upper-level majors.
Degree Awards and Gender Trends

Langston University consistently awards more degrees to women than men, a trend common across U.S. higher education but even more pronounced at HBCUs.
| Year | Total Degrees Awarded | Women | Men | % Women |
| 2021 | 338 | 235 | 103 | 69% |
| 2022 | 344 | 237 | 107 | 69% |
| 2023 | 343 | 238 | 105 | 69% |
| 2024 (est.) | 355 | 245 | 110 | 69% |
Source: Data USA / Langston University Fact Book 2023–2024
Graduation Rate Compared to Other Oklahoma Universities
| Institution | 6-Year Graduation Rate | Retention Rate | Source |
| Langston University | 24–29% | 55–65% | OKHigherEd, 2023 |
| University of Central Oklahoma | 45% | 71% | NCES, 2023 |
| Oklahoma State University | 69% | 85% | NCES, 2023 |
| Northeastern State University | 41% | 69% | OKHigherEd, 2023 |
| Southeastern Oklahoma State University | 38% | 66% | OKHigherEd, 2023 |
Langston’s rates are lower than the state average, but the university’s mission and student profile differ significantly; it emphasizes inclusivity and serves many students from underrepresented backgrounds who may balance work, family, or financial pressures during their studies.
The Role of Institutional Initiatives

Langston University has introduced multiple student success programs to improve outcomes:
- First-Year Experience (FYE) – Supports freshmen with academic coaching, orientation, and career planning.
- TRIO Programs (Upward Bound, SSS, McNair) – Federally funded support for low-income, first-generation students.
- Career and Professional Development Center – Helps students transition into the workforce, contributing to high in-state employment rates (98.8% of graduates remain employed in Oklahoma).
- Online and Evening Programs – Provide flexibility for working adults and non-traditional students, expanding access to degree completion.
Challenges Ahead
While Langston continues to serve its mission, several ongoing issues affect graduation outcomes:
- Financial Constraints – Like many public HBCUs, Langston operates with less endowment funding per student than large universities.
- Student Preparedness Gaps – Many entrants require remedial or bridge courses in math and English.
- Retention Infrastructure – Increasing advising staff, mentorship programs, and digital tracking tools could help improve persistence.
- Small Cohort Volatility – With low cohort sizes, even modest fluctuations in completion rates appear as large percentage swings year to year.
Conclusion
So, how many students graduate from Langston University?
Each year, about 340 students complete their degrees, and roughly 25% of each entering class earn a diploma within six years. While that rate is below the national average, it reflects the university’s distinctive mission: to provide access, not exclusion.
Graduation rates alone cannot define Langston’s value. The majority of its graduates, nearly 99% of Oklahoma residents, remain in-state, contributing to education, healthcare, and public service sectors. Programs like Physical Therapy and Nursing show that with adequate support, Langston students perform at the highest professional levels.