

Global IQ Rankings is a topic across different nationalities or populations can be a sensitive and complex issue.
Intelligence is shaped by a range of factors, including national, political, and geographic influences. Interestingly, scientific studies have indicated that warmer climates may have a negative impact on average IQ levels.
For example, the United States, with an average IQ of 97, ranks 31st globally.
Meanwhile, Hong Kong leads the rankings with an average IQ of 106, while Nepal ranks at the bottom with an average IQ of 51.
Beyond simple rankings, the relationship between intelligence, prosperity, and climate is explored in greater detail through the following table.
Worldwide Intelligence Rankings
| Rank | Country/Region | IQ | Ø Income ($) | Education Expenditure ($/inhabitant) | Ø Daily Max Temp (°C) |
|---|---|---|---|---|---|
| 1 | Hong Kong * | 106 | 35,304 | 1,283 | 26.2 |
| 2 | Japan | 106 | 40,964 | 1,340 | 19.3 |
| 3 | Singapore | 106 | 41,095 | 1,427 | 31.5 |
| 4 | Taiwan * | 106 | 19,812 | 26.9 | |
| 5 | China | 104 | 4,654 | 190 | 18.5 |
| 6 | South Korea | 103 | 22,804 | 1,024 | 18.4 |
| 7 | Netherlands | 101 | 45,337 | 2,386 | 14.6 |
| 8 | Finland | 101 | 42,706 | 2,725 | 8.0 |
| 9 | Canada | 100 | 40,205 | 2,052 | 7.5 |
| 10 | North Korea | 100 | 15.3 | ||
| 11 | Luxembourg | 100 | 71,380 | 3,791 | 14.1 |
| 12 | Macao * | 100 | 44,061 | 1,448 | 26.0 |
| 13 | Germany | 100 | 39,920 | 1,883 | 14.1 |
| 14 | Switzerland | 100 | 70,399 | 3,556 | 15.5 |
| 15 | Estonia | 100 | 13,774 | 749 | 10.3 |
| 16 | Australia | 99 | 42,959 | 2,362 | 24.3 |
| 17 | United Kingdom | 99 | 40,670 | 2,080 | 12.9 |
| 18 | Greenland * | 99 | 24,486 | 4,518 | 0.3 |
| 19 | Iceland | 99 | 47,758 | 3,814 | 8.0 |
| 20 | Austria | 99 | 42,634 | 2,341 | 13.8 |
| 21 | Hungary | 99 | 11,391 | 585 | 17.0 |
| 22 | New Zealand | 99 | 30,133 | 2,025 | 17.5 |
| 23 | Belarus | 99 | 4,661 | 251 | 11.9 |
| 24 | Belgium | 98 | 40,525 | 2,507 | 14.8 |
| 25 | Norway | 98 | 75,130 | 5,425 | 9.6 |
| 26 | Sweden | 98 | 49,535 | 3,419 | 10.0 |
| 27 | Slovenia | 98 | 20,335 | 1,113 | 15.5 |
| 28 | Denmark | 98 | 53,149 | 4,145 | 12.5 |
| 29 | Cambodia | 97 | 776 | 16 | 33.2 |
| 30 | France | 97 | 37,610 | 2,042 | 17.2 |
| 31 | United States | 97 | 49,873 | 2,611 | 19.0 |
| 32 | Poland | 96 | 10,505 | 545 | 13.5 |
| 33 | Czechia | 96 | 15,552 | 712 | 13.5 |
| 34 | Russia | 96 | 8,228 | 337 | 8.9 |
| 35 | Spain | 95 | 26,463 | 1,176 | 21.4 |
| 36 | Ireland | 95 | 43,914 | 2,500 | 13.0 |
| 37 | Italy | 95 | 32,103 | 1,380 | 19.0 |
| 38 | Croatia | 95 | 11,659 | 508 | 18.3 |
| 39 | Latvia | 95 | 11,243 | 585 | 11.0 |
| 40 | Lithuania | 95 | 11,331 | 550 | 11.8 |
| 41 | Israel | 93 | 28,975 | 1,807 | 26.7 |
| 42 | Mongolia | 93 | 2,241 | 128 | 8.6 |
| 43 | Portugal | 93 | 19,253 | 1,005 | 21.7 |
| 44 | Bermuda * | 92 | 108,349 | 1,748 | 24.5 |
| 45 | Bulgaria | 91 | 5,702 | 224 | 18.4 |
| 46 | Greece | 91 | 21,101 | 782 | 22.6 |
| 47 | Moldova | 91 | 2,229 | 141 | 16.5 |
| 48 | Ukraine | 91 | 2,375 | 143 | 15.3 |
| 49 | Vietnam | 91 | 1,446 | 70 | 29.5 |
| 50 | Armenia | 90 | 2,900 | 77 | 16.9 |
| 51 | Kazakhstan | 89 | 6,380 | 233 | 13.5 |
| 52 | Malaysia | 89 | 7,665 | 443 | 32.0 |
| 53 | Myanmar | 89 | 666 | 14 | 32.8 |
| 54 | Thailand | 89 | 4,260 | 182 | 33.1 |
| 55 | Serbia | 89 | 4,876 | 208 | 18.5 |
| 56 | Brunei | 88 | 29,737 | 1,020 | 32.1 |
| 57 | Chile | 88 | 10,195 | 482 | 19.0 |
| 58 | Costa Rica | 88 | 7,480 | 487 | 28.8 |
| 59 | Iraq | 88 | 3,758 | 193 | 32.4 |
| 60 | Romania | 88 | 7,109 | 249 | 15.6 |
| 61 | Uzbekistan | 88 | 1,445 | 85 | 21.8 |
| 62 | Argentina | 87 | 8,795 | 454 | 21.5 |
| 63 | Bosnia and Herzegovina | 87 | 4,118 | 149 | 18.8 |
| 64 | Mexico | 87 | 8,898 | 438 | 30.5 |
| 65 | Turkey | 87 | 8,879 | 335 | 21.5 |
| 66 | Georgia | 86 | 2,921 | 84 | 20.6 |
| 67 | Azerbaijan | 85 | 3,763 | 121 | 22.6 |
| 68 | Sri Lanka | 85 | 2,442 | 53 | 27.2 |
| 69 | Montenegro | 85 | 6,056 | 20.4 | |
| 70 | Bahamas | 84 | 28,622 | 744 | 29.7 |
| 71 | Cuba | 84 | 5,538 | 486 | 30.1 |
| 72 | North Macedonia | 84 | 4,122 | 141 | 18.0 |
| 73 | Bahrain | 83 | 18,838 | 547 | 31.9 |
| 74 | Brazil | 83 | 7,586 | 427 | 30.8 |
| 75 | Philippines | 83 | 2,330 | 67 | 31.9 |
| 76 | Iran | 83 | 4,545 | 173 | 27.0 |
| 77 | Colombia | 83 | 5,037 | 231 | 30.5 |
| 78 | Laos | 83 | 1,157 | 32 | 32.2 |
| 79 | Venezuela | 83 | 8,025 | 273 | 32.4 |
| 80 | Albania | 82 | 3,513 | 118 | 22.9 |
| 81 | United Arab Emirates | 82 | 38,644 | 805 | 34.4 |
| 82 | Dominican Republic | 82 | 4,964 | 157 | 32.0 |
| 83 | Lebanon | 82 | 6,428 | 157 | 23.9 |
| 84 | Afghanistan | 81 | 473 | 16 | 25.5 |
| 85 | Jordan | 81 | 3,091 | 114 | 27.8 |
| 86 | Pakistan | 81 | 992 | 25 | 31.0 |
| 87 | Peru | 81 | 4,311 | 150 | 24.7 |
| 88 | Indonesia | 80 | 2,355 | 71 | 31.6 |
| 89 | Kuwait | 80 | 37,126 | 1,996 | 34.4 |
| 90 | Oman | 80 | 15,332 | 787 | 34.1 |
| 91 | Qatar | 80 | 58,614 | 2,331 | 33.7 |
| 92 | Palestine | 80 | 2,614 | 132 | 27.5 |
| 93 | Bolivia | 79 | 1,912 | 153 | 26.4 |
| 94 | Ecuador | 79 | 4,162 | 198 | 27.9 |
| 95 | Egypt | 78 | 2,175 | 92 | 30.1 |
| 96 | Algeria | 77 | 3,789 | 251 | 27.6 |
| 97 | India | 77 | 1,164 | 47 | 31.5 |
| 98 | Madagascar | 77 | 420 | 13 | 28.7 |
| 99 | Saudi Arabia | 77 | 17,482 | 1,265 | 33.6 |
| 100 | Sudan | 77 | 1,014 | 21 | 36.5 |
| 101 | Syria | 76 | 4,532 | 252 | 25.5 |
| 102 | Bangladesh | 75 | 936 | 19 | 31.0 |
| 103 | Chad | 75 | 630 | 16 | 36.0 |
| 104 | East Timor | 74 | 2,090 | 54 | 30.9 |
| 105 | Jamaica | 74 | 4,356 | 251 | 31.9 |
| 106 | Kenya | 74 | 939 | 62 | 28.8 |
| 107 | Tanzania | 74 | 702 | 29 | 29.1 |
| 108 | Zimbabwe | 74 | 843 | 48 | 28.4 |
| 109 | Senegal | 73 | 1,135 | 56 | 35.6 |
| 110 | Angola | 72 | 2,396 | 84 | 27.6 |
| 111 | El Salvador | 72 | 2,912 | 113 | 27.9 |
| 112 | Morocco | 71 | 2,567 | 139 | 24.4 |
| 113 | South Africa | 69 | 5,941 | 336 | 26.2 |
| 114 | Somalia | 69 | 514 | 1 | 33.3 |
| 115 | Nigeria | 68 | 1,758 | 8 | 33.7 |
| 116 | Ethiopia | 67 | 379 | 21 | 27.7 |
| 117 | Honduras | 67 | 1,665 | 114 | 31.8 |
| 118 | Yemen | 67 | 916 | 84 | 30.3 |
| 119 | Cameroon | 67 | 1,234 | 36 | 31.0 |
| 120 | Congo (Dem. Republic) | 64 | 316 | 7 | 30.3 |
| 121 | Ghana | 61 | 1,166 | 72 | 31.9 |
| 122 | Ivory Coast | 61 | 1,289 | 68 | 32.1 |
| 123 | Guinea | 56 | 598 | 15 | 31.3 |
| 124 | Equatorial Guinea | 56 | 7,625 | 29.7 | |
| 125 | Gambia | 55 | 648 | 14 | 33.3 |
| 126 | Guatemala | 55 | 2,830 | 92 | 35.0 |
| 127 | Sierra Leone | 52 | 412 | 16 | 30.0 |
| 128 | Nepal | 51 | 595 | 22 | 25.6 |
* Dependent territories
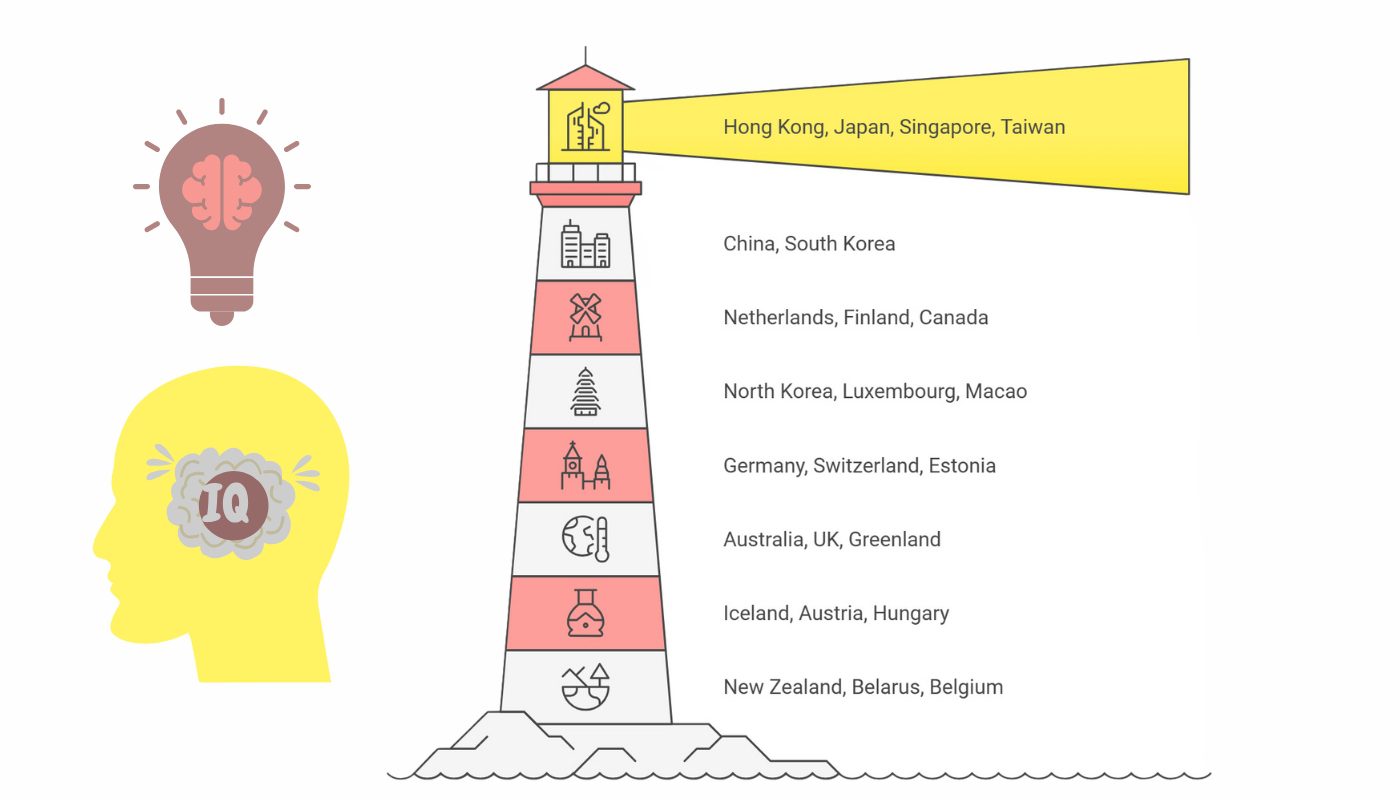
The highest IQ averages are found in Asian regions such as Hong Kong, Japan, Singapore, and Taiwan, where scores reach 106 according to the World Data.
These regions also demonstrate high investments in education and relatively moderate average temperatures.
Countries with higher average incomes and substantial per capita education expenditure, such as Luxembourg and Norway, tend to rank higher in IQ despite variations in climate.
Warmer climates are associated with lower IQ averages, as evidenced by countries like Sudan, Chad, and Nigeria, where daily maximum temperatures exceed 30°C and IQ scores are below 80 as noted in Paw Research Center.
Some high-income countries in extremely hot climates, like Qatar and the UAE, exhibit lower IQ averages, suggesting that wealth alone doesn’t directly correlate to IQ without significant educational investments.
Nordic countries like Finland, Iceland, and Denmark allocate significant resources to education per capita, resulting in IQ scores consistently near or above the global average.
Many nations in Sub-Saharan Africa and South Asia rank at the bottom, with lower income, minimal education expenditure, and extremely high temperatures likely contributing factors.
European nations exhibit mid-to-high IQ scores with a balance of moderate income levels, temperate climates, and steady educational spending as noted by this research.
Some tropical nations like Singapore defy the general trend, leveraging high educational expenditure and economic prosperity to maintain top Global IQ rankings.
Countries with stark income inequality often show below-average IQ scores, indicating that wealth distribution significantly impacts access to quality education.
Lower-ranked countries like Nepal and Sierra Leone face challenges in prosperity and education that may perpetuate lower IQ averages, underscoring the importance of global efforts to address inequality and resource distribution.
Limitations and Misinterpretations of IQ

IQ tests are not a holistic measure of intelligence but are mathematical results based on assessments designed by Western Europeans for their specific cultural contexts.
These tests do not consider critical traits like emotional intelligence, creativity, practical skills, ambition, or diligence. Cultural differences in priorities and education systems further challenge the applicability of IQ tests across diverse populations.
East Asian countries often outperform in IQ rankings due to their structured, goal-oriented educational practices, which align with traits valued in IQ tests.
Other cultures that emphasize different values may score lower, reflecting priorities rather than intellectual capacity.
The Rising IQ Trend: Flynn Effect
The Flynn Effect, identified by James R. Flynn in 1984, highlights the consistent rise in IQ scores over time in Western industrialized nations.
Research indicates an annual increase of approximately 0.3 to 0.5 points, with women experiencing a faster rate of improvement compared to men.
However, some nations exhibit a reverse Flynn Effect, where IQ levels decrease over time.
IQ, Income, and Education Spending

A correlation between IQ, income levels, and education expenditure is evident from the data. High-income nations typically rank higher in IQ, but exceptions like China, Mongolia, and Eastern European countries show strong performance despite lower income levels.
Interestingly, nations with higher education expenditures often have more intelligent populations, but this correlation is not absolute. Many high-ranking countries, especially in East Asia, invest heavily in education at the family level rather than relying on government spending.
Climate and Intelligence Development
Since 1991, studies have explored the impact of climate on IQ.
Colder climates were initially thought to necessitate greater physical fitness and complex social structures, potentially leading to higher IQs.
Professor Richard Lynn suggested that colder temperatures might influence brain volume, although the connection between brain size and intelligence remains debated.
Hot climates are generally considered a disadvantage for IQ development, attributed to the increased physical energy demands and stress caused by heat as it is noted in Royal Society Publishing.
No Correlation Between IQ and Skin Color

No study has conclusively linked geographic ancestry or skin color to IQ levels.
Variations within populations, such as in Brazil (e.g., Blacks 71, Mulattoes 81, Whites 95, Japanese 99), have been attributed to factors like education, socioeconomic status, and origin rather than racial differences.
In 2006, researchers Donald Templer and Hiroko Arikawa noted a correlation between darker skin pigmentation and lower IQ.
However, this was attributed to climate-related conditions influencing pigmentation rather than skin color itself.
Similar patterns were observed within other population groups, confirming that environmental and educational factors, not pigmentation, drive these differences.
Alternative Approaches to Measuring Intelligence
While IQ is a commonly used metric, it is not the only way to assess intelligence.
Various alternative methods offer broader perspectives on identifying the smartest countries in the world.
These include evaluating academic test scores, analyzing a nation’s ability to “expand the frontier of knowledge” through innovation and data technology, and considering achievements such as the number of Nobel Prizes won.
These diverse measures capture different facets of intellectual capability and contributions beyond standardized IQ assessments.
Top 10 Smartest Countries Based on Students’ Test Scores in Reading, Math, and Science (OECD PISA 2022)
| Rank | Country | Total Score | Reading | Math | Science |
|---|---|---|---|---|---|
| 1 | Singapore | 1679 | 575 | 561 | 543 |
| 2 | China | 1605 | 552 | 543 | 510 |
| 3 | Japan | 1599 | 536 | 547 | 516 |
| 4 | Taiwan | 1599 | 547 | 537 | 515 |
| 5 | South Korea | 1570 | 527 | 528 | 515 |
| 6 | Hong Kong | 1560 | 540 | 520 | 500 |
| 7 | Estonia | 1547 | 510 | 526 | 511 |
| 8 | Canada | 1519 | 497 | 515 | 507 |
| 9 | Ireland | 1512 | 492 | 504 | 516 |
| 10 | Switzerland | 1494 | 508 | 503 | 483 |
Singapore leads significantly with the highest cumulative scores across reading, math, and science, reflecting its strong emphasis on education according to the World Population Review.
East Asian countries (Singapore, China, Japan, Taiwan, South Korea, and Hong Kong) dominate the top positions, showcasing their rigorous education systems.
Most top countries exhibit balanced scores across all subjects, although Singapore particularly excels in reading.
Estonia, Ireland, and Switzerland are notable European entries, with Estonia standing out for high scores in math and science.
Canada maintains a solid position with consistent scores across all three disciplines, representing North America.

Top 10 Countries with the Highest Intelligence Capital Index (2017)
| Rank | Country | Intelligence Capital Index | Grade |
|---|---|---|---|
| 1 | United States | 74.9 | A+ |
| 2 | United Kingdom | 64.2 | A |
| 3 | Germany | 64.2 | A |
| 4 | Australia | 64 | A |
| 5 | Singapore | 63.6 | A |
| 6 | Switzerland | 61.6 | A |
| 7 | Sweden | 61.6 | A |
| 8 | Canada | 61.2 | A |
| 9 | Finland | 60.5 | A |
| 10 | Denmark | 60.3 | A |
The U.S. holds the highest intelligence capital index, reflecting its robust research, development, and innovation ecosystems.
This ranking is dominated by Western countries, showcasing their strong educational infrastructure and economic investments in intellectual capital.
Singapore appears in both tables, highlighting its global recognition for education and intellectual contributions.
Countries like the United Kingdom, Germany, and the Nordic nations demonstrate high intelligence capital due to well-rounded educational and technological advancements.
Many countries (e.g., Canada, Switzerland, and Singapore) feature prominently in both rankings, indicating a correlation between test performance and intelligence capital development.
Methodology
This article draws upon extensive research conducted on national intelligence, including foundational work by psychologist Richard Lynn and collaborators such as Tatu Vanhanen and David Becker.
Lynn and Becker’s studies, though controversial due to their methodologies and conclusions, brought significant attention to the study of IQ across nations.
Data sources include actual test results (T) and estimates (E) extrapolated from neighboring countries.
Complementing these findings are insights from the OECD’s Programme for International Student Assessment (PISA), which evaluates 15-year-olds’ application of knowledge in real-world contexts, with the latest data released in 2022.
Additionally, the Intelligence Capital Index (ICI), developed by economist Kai L. Chan and updated in 2017, offers a broader measure of national intellectual capacity. These diverse sources provide a multidimensional perspective on intelligence across nations.
References:
- World Data – IQ by Country
- ResearchGate – The Relationship Between IQ and Climatic Variables in African and Eurasian Countries
- Royal Society Publishing – Impact of Heat Stress on Cognitive Performance
- PubMed – The Flynn Effect: A Meta-Analysis of the Increases in IQ Over Time
- ScienceDirect – Brain Size, Intelligence, and the Role of Climate
- World Population Review – Average IQ by Country
- ScienceDirect – Skin Color and Intelligence: A Climatic Perspective
- ResearchGate – The European Bell Curve: IQ, Education, and Inequality