Share Post:
Full Sail University is often noted for its innovative programs and fast-track courses in various creative fields.
Despite its reputation, the university has a relatively low graduation rate.
The main reason for this is the demanding coursework and specialized programs that require significant dedication and effort from students.
This can be overwhelming for many who are not fully prepared for the intensity and rigor of the curriculum.
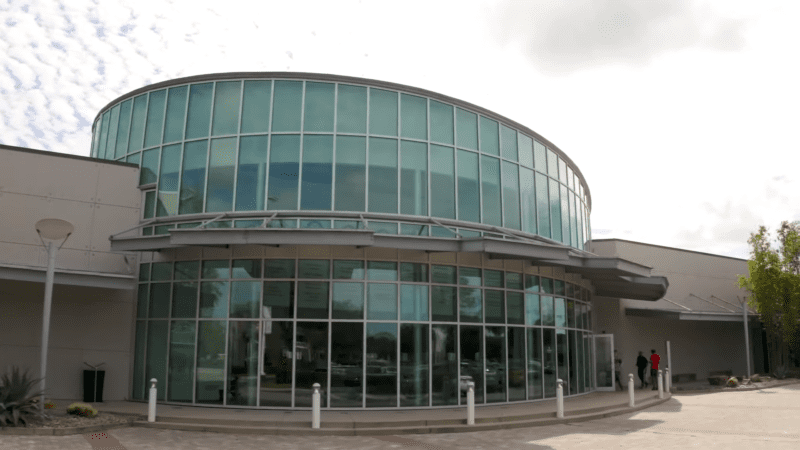
This is a large private institution situated in a suburban area of Winter Park, Florida.
With a total undergraduate enrollment of 24,187 students, the university maintains a selective admissions process.
It offers 24 bachelor’s degree programs, has an average graduation rate of 40%, and a student-to-faculty ratio of 36:1.
The annual tuition and fees amount to $25,687.
More About Full Sail University and Its Low Graduation Rates
Full Sail University is a private institution located in Winter Park, Florida. It provides a variety of degree programs tailored to the entertainment, media, arts, and technology industries. Degree offerings include:
- Associate Degrees
- Bachelor’s Degrees
- Master’s Degrees
The campus environment is suburban, creating a blend of academic facilities and residential life.
Full Sail University has a total undergraduate enrollment of approximately 24,187 students according to BestColleges. Admission to the university is selective, emphasizing that prospective students meet certain criteria to be considered.
The institution has a student-faculty ratio of 36:1 as per appily.com. This ratio indicates the number of students per faculty member, which can impact the level of individual attention a student may receive.
Graduation and Retention Rates provide insight into student success. According to available data:
- The average graduation rate is 40%
- The 6-year graduation rate for first-time, full-time students stands at 29%
The university is notable for being military friendly, offering support and resources for veterans and active-duty military members.
Accreditation and Academic Standards
Full Sail University is licensed by the Commission for Independent Education, Florida Department of Education. This ensures that the institution meets specific educational standards required by the state.
Accreditation plays a crucial role in evaluating the academic integrity of the programs offered. Full Sail’s accreditation confirms adherence to the quality standards set by the accrediting body.
The university offers specialized programs that demand significant dedication and effort. These rigorous academic standards might contribute to the relatively low graduation rates, as students face challenging and intense coursework.
Enrollment Criteria and Student Demographics
Full Sail University has an open enrollment policy, which means admission requirements are less stringent than those of traditional universities. This policy aims to provide educational opportunities to a broader range of students, often attracting individuals who may not meet the typical academic criteria of other institutions.
Admission
| Category | Details |
|---|---|
| Admissions Breakdown | Highly selective acceptance rate. |
| Retention Rate Insight | 76% of full-time students who started in Fall 2020 returned in Fall 2021. |
| Graduation Rate Insight | 40% of full-time, first-time students who began in Fall 2015 graduated. Most students are adult learners, so the number of first-time students is traditionally low. |
| Application Considerations | – Test scores: Not required |
Transfer Credit Policy
- Dual enrollment: Yes
- Credit for qualified life experience: Implied no
- Advance placement (AP) credits: Yes
Student Population Overview
- Total Enrollment: approximately 21,000 according to their website.
Gender Distribution
- Male: 68% (18,303 students)
- Female: 32% (8,434 students)
Racial and Ethnic Composition
- White: 37%
- Black or African American: 27%
- Hispanic or Latino: 18.%
- Two or More Races: 6%
- Asian: 2%
- American Indian or Alaska Native: 1%
- Native Hawaiian or Other Pacific Islanders: 0.217%
Geographic Diversity
- Out of State Students: 65.36%
- Out of Country Students: 0.81%
- Student Location Diversity Score: 95 out of 100
The student body represents all 49 states and Washington D.C., reflecting significant geographic diversity.
Online Programs
| Category | Details |
|---|---|
| Offers Online Programs | Yes |
| Online Programs | 64 |
| Total Online Enrollment | ~21000 |
| Student Location Breakout | – 100% Online |
Percent of Programs Online
- 81% Online
- 19% On-campus
Types of Online Programs Offered
- Certificates: 94% online
- Associate: 75% online
- Bachelor’s: 75% online
- Graduate Certificate: 100% online
- Master’s: 85% online
- Doctorate: Not offered
The institution offers 64 online programs, with a total online enrollment of 25,607 students.
All students are 100% online with no on-campus component.
Around 81% of the programs are online, while 19% are on-campus.
The institution offers a variety of online programs, including certificates (94% online), associate and bachelor’s degrees (75% online), graduate certificates (100% online), and master’s programs (85% online).
However, doctoral programs are not offered online.
| Programs | BA | MA | Doctorate | |
|---|---|---|---|---|
| 1 | BUSINESS, MANAGEMENT, MARKETING, AND RELATED SUPPORT SERVICES. | Yes | Yes | NO |
| 2 | COMMUNICATION, JOURNALISM, AND RELATED PROGRAMS. | Yes | Yes | NO |
| 3 | COMMUNICATIONS TECHNOLOGIES/TECHNICIANS AND SUPPORT SERVICES. | Yes | – | NO |
| 4 | COMPUTER AND INFORMATION SCIENCES AND SUPPORT SERVICES. | Yes | Yes | NO |
| 5 | EDUCATION. | – | Yes | NO |
| 6 | ENGINEERING TECHNOLOGIES/TECHNICIANS. | Yes | – | NO |
| 7 | ENGINEERING. | Yes | – | NO |
| 8 | ENGINEERING/ENGINEERING-RELATED TECHNOLOGIES/TECHNICIANS. | Yes | – | NO |
| 9 | ENGLISH LANGUAGE AND LITERATURE/LETTERS. | Yes | Yes | NO |
| 10 | MULTI/INTERDISCIPLINARY STUDIES. | Yes | Yes | NO |
| 11 | VISUAL AND PERFORMING ARTS. | Yes | Yes | NO |
Financial Considerations and Debt
Tuition and Required Fees
| Student Level | In-state | Out-of-state |
|---|---|---|
| Undergraduate | $59,784 | $59,784 |
| Graduate | $54,672 | $54,672 |
Both in-state and out-of-state students pay the same tuition fees. The tuition for undergraduate students is $59,784 per year, while for graduate students, it is slightly lower at $54,672 annually. This uniform pricing model highlights that residency status does not impact the cost of tuition.
Cost of Undergraduate Attendance (2021–2022)
| Costs to Consider | Price |
|---|---|
| Books and supplies | $1,200 |
| On-campus room and board | $17,758 |
| On-campus other expenses | $2,600 |
| Off-campus (not with family) room and board | N/A |
| Off-campus (not with family) other expenses | N/A |
| Off-campus (with family) other expenses | N/A |
The estimated costs for books and supplies are $1,200 annually. On-campus living expenses, including room and board, amount to $17,758, with additional on-campus expenses estimated at $2,600. Off-campus cost details are currently unavailable, making it difficult to estimate for students not living on campus.
Total Undergraduate Cost
| Cost Category | In-state | Out-of-state |
|---|---|---|
| On-campus | $81,342 | $81,342 |
| Off-campus without family | $60,984 | $60,984 |
| Off-campus with family | $60,984 | $60,984 |
The total cost of attendance for students living on campus is approximately $81,342 per year, while those living off-campus with or without family have lower expenses at $60,984 annually. This provides a clearer picture of how on-campus living increases the total cost compared to off-campus living.
Financial Breakdown
| Type of Aid | Percentage of Students Receiving Aid |
|---|---|
| Federal Grant Aid | 51% |
| State Grant Aid | 5% |
| Institution Grant Aid | 48% |
| Pell Grant | 51% |
The majority of students receive some form of financial aid. Around 51% of students benefit from federal grant aid, with 48% receiving institutional grants. The same percentage (51%) of students qualify for Pell Grants, while only 5% receive state grant aid, indicating a strong reliance on federal and institutional support.
Average Aid Awarded
| Type of Aid | Average Award |
|---|---|
| Federal Grant Aid | $5,067 |
| State Grant Aid | $2,172 |
| Institution Grant Aid | $8,498 |
| Pell Grant | $4,895 |
On average, students who qualify for federal grants receive $5,067 in aid, while Pell Grant recipients receive close to $4,895. The average institutional grant is significantly higher at $8,498, while state grants are lower, averaging $2,172 per student. This shows the university’s emphasis on institutional support for students.
Financial Outlook
| Category | Amount |
|---|---|
| Average student debt after graduation | $27,000 |
| Average salary 6 years after starting school | $34,000 |
Graduates leave the university with an average student debt of $27,000, which is in line with national averages.
Six years after starting school, the average salary of graduates is around $34,000, indicating a moderate return on investment for students pursuing education at this institution.
Household income plays a significant role in determining the amount of aid students might receive.
For households earning between $0 – $30,000, the average grant and scholarship aid received is around $7,822 according to Bankrate. Even with such aid, the remaining costs still represent a considerable financial load.
Student Support and Resources
Full Sail University offers various resources aimed at helping students succeed. Academic advising is available to guide students through their programs and ensure they meet graduation requirements.
Tutoring services provide additional academic support in challenging subjects. These services are accessible both in-person and online to accommodate diverse schedules.
The Career Development Department assists students with job placement by offering resume workshops, interview coaching, and networking opportunities.
Students have access to the Full Sail Library, which offers a range of digital and physical resources. This includes textbooks, academic journals, and industry-specific publications.
Technical support is also provided to help students navigate the university’s online platforms and resolve any technical issues they may encounter. This ensures that students can focus on their studies without unnecessary disruptions.
Mental health resources include counseling services to help students manage stress and other personal issues. Confidential counseling sessions are available to provide emotional and psychological support.
Students are encouraged to join student organizations and clubs to enhance their university experience. These organizations provide social, academic, and professional opportunities, fostering a sense of community.
Workshops and seminars are regularly hosted to address various academic and career-related topics, such as time management, study skills, and industry trends. These events help students stay informed and prepared for their future careers.
Comparative Analysis with Other Institutions
Full Sail University’s graduation rate is a point of concern for many prospective students. To provide context, it helps to compare Full Sail with other similar institutions.
Graduation Rates
- Full Sail University: Approximately 27% for four-year programs.
- Savannah College of Art and Design (SCAD): Around 66%.
- Art Institute of Atlanta: Approximately 29%.
Cost of Attendance
- Full Sail University: Tuition can reach or exceed $81,342.
- SCAD: Estimated annual cost exceeds $38,000.
- Art Institute of Atlanta: Roughly $17,000 per year.
Retention and Student Support
- Full Sail University: High dropout rates, largely attributed to open admission policies and lack of drive or discipline among some students (Reddit review).
- SCAD: Better student support and academic counseling.
- Art Institute of Atlanta: Varied student support services though somewhat limited.
Accreditations and Rankings
- Full Sail University: Accredited by ACCSC, recognized for video game design.
- SCAD: Accredited by SACSCOC and offers a wide range of top-ranked programs.
- Art Institute of Atlanta: Accredited by ACICS, with specialized programs in culinary arts and design.
Comparing these attributes helps highlight both strengths and weaknesses. Each institution provides unique opportunities and challenges, influencing their respective graduation rates and overall student success.
Related Posts:


